

Young professionals and students in the engineering and technology disciplines are predominantly focused on developing their technical attributes in order to succeed in their careers. As their careers progress, they find themselves facing the daunting task of rapidly transitioning into a management role and realise that they need a set of skills which they haven’t developed sufficiently. We delve into this topic with a series of articles with Claudio Insaurralde the IEEE Victorian Section TEMS Chair and Region 10 Industry Relations committee member.
This article is a part of the series on Engineering to Manager and a continuation of https://yp.ieee.org/from-engineer-to-manager-mastering-the-transition-part-3/
Managers must be able to make informative decisions, why are key performance indicators (KPI’s) important?
We need to know where we currently are, to be able to get to our destination. In the same way, if a manager wants to lead his department in the right direction, first he needs to know where the department or company is in terms of efficiency, productivity, problems, budget, etc. Otherwise he might be concentrating his efforts in things that are not the most important. That is exactly what KPIs do, they provide information about our current situation.
There are a wide variety of KPIs and they are usually industry or department specific. We can find KPIs for Manufacturing, Finances, Environmental issues, project management and so on.
KPIs are really useful but they can be also difficult to calculate and to keep updated. So, you should keep track of up to 5 KPIs and if possible, you should use data and information that is being currently used to calculate them. This will make things easier, especially for small companies or departments.
It’s better to have 2 or 3 highly relevant KPIs up to date, than 8 KPIs that are not correctly updated and might drive you to make wrong decisions based in misleading information.
Please describe the basic concepts of information use for decision making.
First, it’s important to differentiate between Data and Information. Data is what we obtain from the source, it’s plain facts and statistics. Information is what we obtain after processing the data adding value to it by putting it into context and organising it towards a specific purpose.
It’s important to have the right information in terms of quality and quantity. Data should come from trustworthy sources and be processed in the right way. But It is also vital to have the right amount of information.
Not having enough information may lead us to make a decision with no basis but, on the other hand, having too much information may also be a problem. In fact, when someone is unable to make a decision because there is too much information it’s called ‘analysis paralysis’ and sometimes this is used as a corporate tactic to purposely delay a decision.
Once we have the right information, we can use it in many ways in our decision making processes:
To forecast specific behaviour. Once we have studied the information and obtained models for our processes we can predict future problems or situations using the current data. We can even do it automatically which is called condition monitoring.
To find out what is causing a problem. Sometimes we can identify patterns that lead us to the cause of a problem. Sometimes those patterns are evident but other times we need to work with the data to get the answer. This could go from filtering and rearranging it to using complex software to analyse it.
To support our decisions. There are situations when we already know what the problem is, but we need the information to help us prove that we are right. This is particularly useful when we need to ask for money to solve the problem. As a general rule, the greater the amount of money necessary to implement the solution, the more information we will need to convince the top management that they have to invest on that.
To know our current situation, which is usually done using KPIs.
Problem solving and root cause analysis (RCA) are vital for managers. Can you please elaborate on them?
No matter in what industry or engineering area we are working, we will always face problems in our workplace. Companies spend many resources in solving problems and, as managers, it is one of our main responsibilities to ensure that problems are solved. However, frequently those resources are used to deal with issues that are not the real problem but only their symptoms or consequences. If that is the case, it won’t take long to the problem to come up again.
So, the key in dealing with problems is the ability to identify what is really causing them. If we consider that the current situation (our problem) is the result of a chain of events, we can follow it backwards until we find the first event that started everything. That is what we call the ‘root cause’. The process used to find it is called Root Cause Analysis (RCA) and can be done using many different techniques.
Finding a root cause could be a difficult task and usually factors like lack of time and pressure from the stakeholders make things even more complicated. That is why many times it’s easier to deal with the symptoms and quickly get things running back again, than starting a RCA which usually takes more time. However, managers should know that the last one is the best option in the long term.
Can you describe the difference between chronic and acute problems, their characteristics and provide examples?
Chronic problems are usually hidden in everyday activities so they are difficult to detect. They might be hidden behind minor issues that require small adjustments. Their effects are cumulative but in some cases can be really costly. They can be detected by detailed observation, usually using statistical analysis and since they don’t stop our operations, we usually have more time to find a solution. I used to work in the automotive industry, an operator had to manually correct the chassis position on a transport board every now and then. I designed and implemented a Failure Reporting, Analysis and Corrective Action System (FRACAS) for the production line, so we could quantify the effects of that manual correction. That innocent adjustment was responsible of considerable delays and losses of productivity and once detected we started working in the solution. Since the effects were cumulative, only after the analysis we identified that the problem needed to be fixed.
On the other hand, acute problems are emergencies. They stop our operations, they are evident and disruptive situations that need immediate actions. This urgency makes it harder to find the root cause, which is done by a process called Fault Isolation. In a food manufacturing company I used to work, they have a loading bar that every now and then went out of sequence moving some trays forward when they were not ready. These trays usually got jammed and the loading bar often went out of position. So, to resume production, they used to put the bar back in position and reset the system, losing a lot of time, product and damaging some of the costly trays. Unfortunately, I wasn’t working in maintenance at that time, but it was clear that they were not fixing the root cause (that might be a problem with sensors alignment or the PLC sequence), they were just dealing with the consequences and symptoms trying to minimise downtime (in the short term).
Please explain the 5 why’s in RCA and their importance.
The 5 Why’s is a useful technique that force us to think in terms of root causes. By asking why many times, we start going back in that chain of events that I mentioned before, and eventually we reach the root cause.
This technique was originated in Japan, at Toyota industries and it’s good to deal with simple to intermediate complex problems. Basically, we need to keep asking why until we find the root cause. Normally the root cause will be find between the first 5 whys, but you should keep asking why until you find it.
To be successful, we need to give answers backed up with information and facts and not just suppositions.
To give a simple example, let’s suppose that a wrong item was shipped to a customer. We ask why and we find out that the wrong item was pulled out from inventory. But we keep asking and we also find that the item was mislabelled, the supplier had made the mistake prior to shipping it to us, the person who place the labels used the wrong one because labels from different orders are pre-printed and it’s easy to apply the wrong one. So, the solution would be to work in a better system to label the items.
What is Pareto Analysis?
Pareto analysis is a statistic technique to identify the main causes of a problem. It’s a simple but powerful technique that help us prioritise our work and make a better use of our resources. When we have complex problems, we have many variables and causes affecting the situation. Pareto principle says that from all those causes only 20% of them are causing 80% of the effects or problems. That means that if we tackle the wrong causes we can eliminate 80% of them and still suffer from the majority of the problems. So the most cost effective strategy is to identify and focus on that 20% of critical causes to eliminate the majority of the problems.
In practice, we use the available data and process them, classifying every problem and cause in categories to identify the most relevant. The way we classify them will depend on our objectives and interests. If we are looking to reduce costs, we’ll use the problems financial impact, if our problem is downtime, we’ll emphasize that, and so on.
I’ve used this many times, especially when you approach a system, manufacturing line or equipment that has many issues. You find so many problems that you don’t know where to start so the better approach is to analyse the available information (or generate it if necessary) and decide which problems are that 20% that needs to be addressed first.
What are control charts and how can they be effectively used?
Control charts are a great tool used in statistical control of processes. Mainly is a graph showing a variable over time. We have lower and upper limits so we can control that the values are within specifications. This monitoring activity can be done automatically based in the instantaneous values or we can identify trends to start correcting the process before it goes out of control.
Besides this typical use, this charts can be also used to identify root causes. We can study the values over a period of time and correlate the out-of-limit values with known event that happened during that time. Those event can be taken from the operation’s registers, PLC’s log files, etc.
Sometimes that relation between the failures and the events are not so evident and the pattern is hidden in the data. So we need to filter some values or play with the temporal scale. One simple example of this last case is when we have recurrent problems but we can’t identify any pattern. Then we change the temporal distribution and show the data grouped by shift and we find out that most of the problems are happening in a specific shift, which is a valuable clue to keep investigating in that direction.
Why are cause & effect diagrams essential for managers?
Cause and effect diagrams, which are also called fishbone and Ishikawa diagrams are a great tool to add some clarity to complex problems. The diagram is simple, we have the problem written on the right and then different branches with different categories where we can group the causes and its effects.
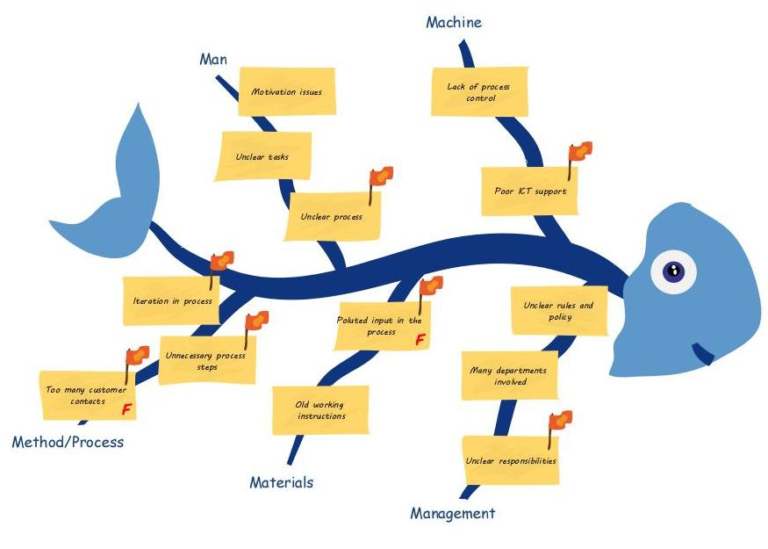
This is a truly powerful technique, especially when it’s combined with brainstorming. It is extremely effective for complex problems involving multi-disciplinary factors. The categories used are flexible and they depend on the industry and type of problem, but the typical ones are People (things related with our personnel), methods/processes (the way we are doing things), machine/equipment, materials (used to create our products), environment (things like high temperatures, humidity, contamination, etc.) and measurements (how and when we gather the information).
These techniques like brainstorming and cause and effect diagrams, sound really easy to carry out when explained, but in practice they have their particularities. That is why during the workshop, we organised practical activities, so the attendants could experience the difficulties that may come up when applying them, even when they were dealing with hypothetical problems.
About Claudio
Claudio Insaurralde is an independent Reliability and Asset Management Consultant and has over 10 years’ experience in engineering management within the defence aviation and manufacturing sectors. He graduated with honours from the Argentinean Air Force Officers Academy and holds a Bachelor degree in Electronics Engineering and a postgraduate certificate in management. Claudio is the TEMS Chapter Chair for the IEEE Victorian Section and a member of the IEEE Region 10 Industry Relations Committee.